KPI Spreadsheet Template for Tracking Brain Retraining Academy Metrics
When it comes to optimizing the performance of a brain retraining academy, using a KPI spreadsheet template is not just helpful, it’s essential. These templates allow you to track the most important key performance indicators (KPIs) that measure student progress, cognitive improvements, and overall program effectiveness. Whether you’re managing a small academy or running a large-scale training program, implementing a structured KPI system ensures you’re making data-driven decisions that foster both student success and program growth.
What is a KPI Spreadsheet Template?
A KPI spreadsheet template is a tool that helps track and monitor the performance of key metrics. In the context of a brain retraining academy, it enables instructors and administrators to easily evaluate important data points such as enrollment rates, cognitive improvements, and student satisfaction. A well-structured KPI template streamlines the process of recording, analyzing, and reporting on these metrics, making it easier to identify areas that need improvement and areas that are performing well.
With the right tracking system in place, an academy can ensure that each student receives the best possible learning experience, while also maximizing the effectiveness of the training program. These insights help in continuously refining the curriculum, improving retention rates, and boosting cognitive outcomes for students.
Core Metrics to Track in a Brain Retraining Academy
When building your KPI spreadsheet template, it’s crucial to include the right metrics. Below are some of the key indicators that you should be tracking:
- Enrollment Rate – The number of new students enrolled per period, e.g., 50 new students per month.
- Attendance Rate – The percentage of sessions attended by enrolled students, typically aiming for 90% attendance or higher.
- Completion Rate – The percentage of students who complete the full program, with a goal of around 85% completion rate.
- Knowledge Retention Rate – The percentage of information retained by students after completing the program (measured through post-training assessments), ideally above 70% retention after 3 months.
- Assessment/Test Scores – Average scores on cognitive or neuropsychological tests, typically aiming for an 80% average score or higher.
- Student Satisfaction Score – The average satisfaction rating from post-program surveys, with a goal of achieving a score of 4.5/5.
- Program Dropout Rate – The percentage of students who leave the program before completing it, ideally kept below 10%.
- Cognitive Improvement Index – A measure of cognitive change, based on pre- and post-training test scores, ideally aiming for a 15% improvement or more.
- Emotional Well-being Index – This tracks improvements in students’ emotional well-being, such as reduced anxiety, stress, or mood improvements, ideally seeing a 10% improvement post-program.
- Cost per Student – The total program cost divided by the number of students, helping you track the financial efficiency of your program.
These metrics allow for a clear view of both the academic success and emotional well-being of your students, helping you better tailor the program to meet their needs.
How to Set Up Your KPI Spreadsheet Template
Setting up your KPI spreadsheet template requires a few key steps. Whether you’re using Excel or Google Sheets, the setup process is straightforward. Here’s a quick guide:
- Step 1: Define Your Metrics – Start by listing all the key metrics that you want to track (refer to the list above). Each metric will become a column in your spreadsheet.
- Step 2: Organize Your Data – Create separate sheets for different categories, such as:
- Sheet 1: KPI Dashboard (Summary View)
- Sheet 2: Student Details (Enrollment date, attendance, scores)
- Sheet 3: Trainer Feedback (Trainer ratings and session reviews)
- Step 3: Automate Calculations – Use built-in functions like
AVERAGEandSUMto automatically calculate metrics like average test scores, dropout rates, and completion rates. - Step 4: Visualize the Data – Incorporate graphs and charts to visually track trends over time. This is especially helpful for metrics like cognitive improvement and student satisfaction.
- Step 5: Update Regularly – Regularly update your spreadsheet with new student data, test scores, and feedback to keep the KPI metrics relevant and accurate.
For more tips on how to structure your spreadsheets, you can check out these external resources:
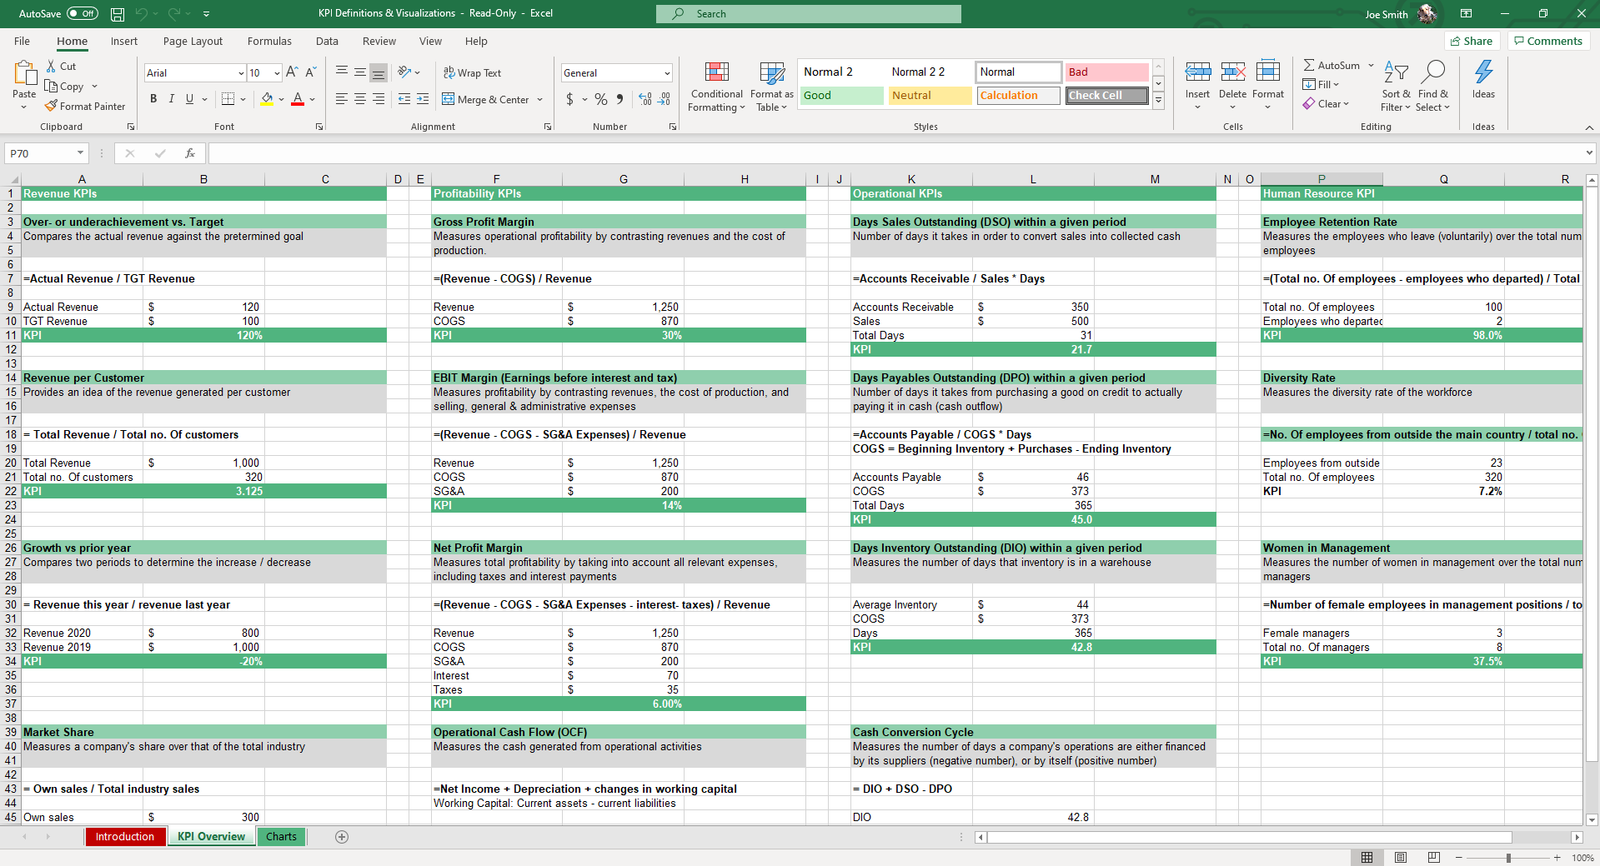
Example of KPI Spreadsheet Layout for Brain Retraining Academy
To help you visualize what your KPI spreadsheet will look like, here’s an example layout:
The example above shows a KPI dashboard with key metrics such as enrollment, attendance, completion rate, and more. Each metric is tracked monthly to give you a quick overview of your academy’s performance.
Best Practices for Tracking KPIs in a Brain Retraining Program
Once you’ve set up your KPI spreadsheet template, it’s important to follow best practices to ensure that you’re getting the most out of your data:
- Set Clear Targets: For each KPI, define what success looks like. For example, aim for a 90% attendance rate or an 80% average cognitive improvement. Setting targets gives your team something to strive for and ensures consistency across the board.
- Collect Feedback Regularly: Use surveys for both students and instructors to gather feedback on the effectiveness of the program. This qualitative data complements your quantitative metrics.
- Review Data Regularly: Schedule periodic reviews of your KPI data. This could be monthly or quarterly, depending on the size of your academy. Regular reviews help you identify trends, spot issues early, and adjust your strategies as needed.
- Visualize Trends: Graphs and charts make it easier to see changes over time. Create a line graph to track improvements in cognitive performance or a bar chart to measure student satisfaction.
By implementing these best practices, you ensure that your program remains dynamic and responsive to the needs of your students and instructors.
For more information on creating effective KPI spreadsheets for other educational programs, visit our NeuroTechInsider website.
Benefits of Using a KPI Spreadsheet Template for Tracking Student Progress
Incorporating a KPI spreadsheet template into your brain retraining academy brings significant advantages that improve both student outcomes and program efficiency. Here are some of the key benefits:
- Data-Driven Decisions: With KPIs, you have real-time access to vital data that enables you to make well-informed decisions about your program. Whether it’s adjusting teaching methods or introducing new strategies, having metrics to guide you ensures that changes are effective.
- Enhanced Student Success: By tracking performance metrics like attendance and knowledge retention rates, you can identify students who might be struggling and offer additional support. This personalized approach leads to improved overall student success.
- Objective Performance Evaluation: Rather than relying on subjective assessments, KPIs provide an objective way to measure program success. By focusing on data, you remove bias and gain a clearer picture of your academy’s impact.
- Better Resource Allocation: Tracking metrics such as student satisfaction and cognitive improvement helps allocate resources more effectively. If a particular area is underperforming, you can focus your resources there to boost outcomes.
- Increased Transparency: Sharing KPI results with students and staff fosters transparency and trust. It gives everyone involved in the program clear insights into what’s working and what needs improvement, encouraging collaboration and accountability.
Integrating Feedback and Adjusting Strategies
The feedback loop is a critical part of any successful brain retraining program. By regularly collecting feedback from students, trainers, and other stakeholders, you can adjust your strategies and KPIs to continuously improve the program. Here’s how to effectively integrate feedback:
- Student Surveys: Implement post-program surveys that assess student satisfaction, knowledge retention, and emotional well-being. Questions should focus on both the cognitive aspects of the program and the overall learning experience.
- Trainer Feedback: Collect insights from trainers regarding the effectiveness of the materials and the overall structure of the program. This feedback can highlight any gaps in the content or instructional methods.
- Performance Reviews: Conduct regular performance reviews based on the tracked KPIs. For example, if attendance rates are dropping, find out whether it’s due to external factors, curriculum content, or other issues.
- Adjusting KPIs: Based on feedback, don’t be afraid to adjust the KPIs. For instance, if student feedback suggests a need for greater focus on emotional well-being, you might add new metrics to better track this area.
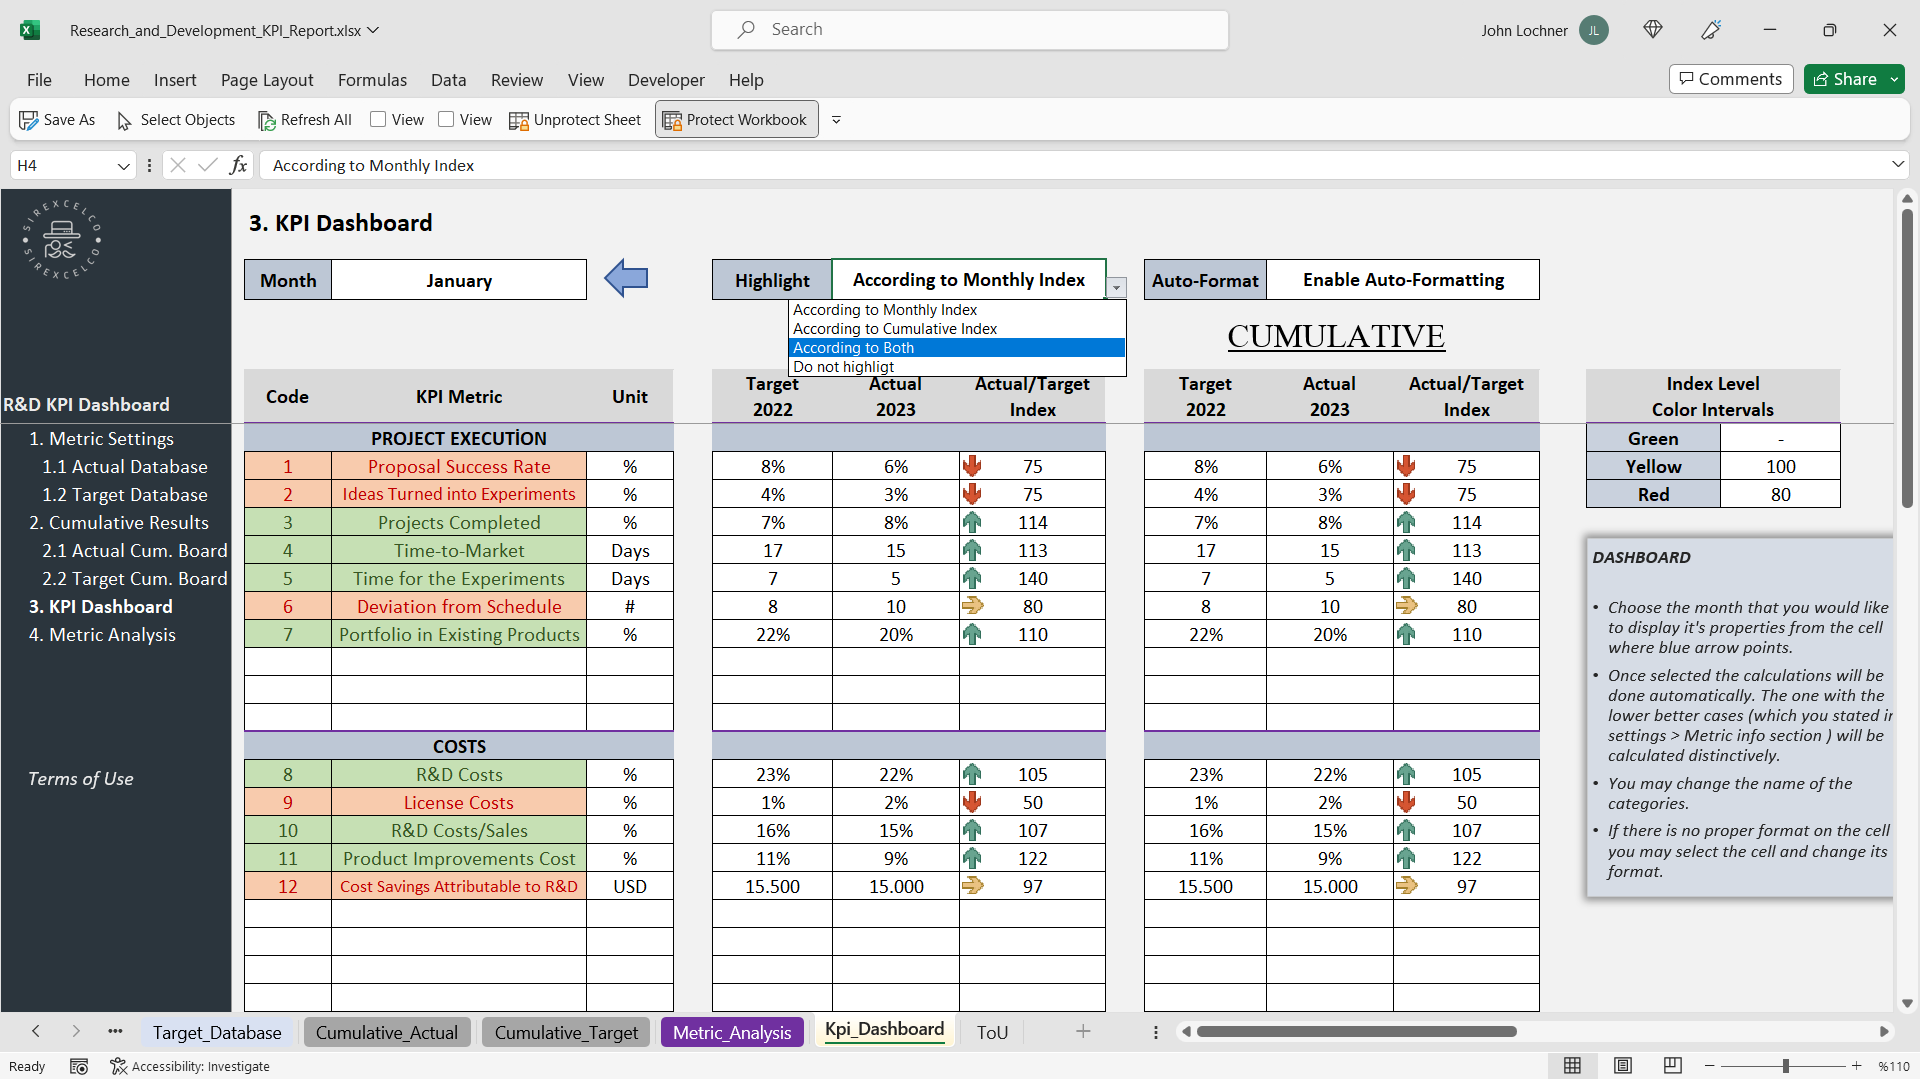
Example of KPI Spreadsheet Layout for Brain Retraining Academy
Having a clear and easy-to-understand layout for your KPI spreadsheet is essential for tracking and interpreting data effectively. Below is an example of how your spreadsheet can be structured:
As shown in the image, you can have columns dedicated to each metric, like enrollment rate, cognitive improvement, and emotional well-being index. The rows represent different time periods (monthly, quarterly) to track trends over time.
By organizing your data into digestible sections, you can quickly identify trends and make adjustments as needed. This visual layout helps in making informed decisions that can improve the overall training program.
How to Optimize Your KPI Tracking for Maximum Impact
Optimizing your KPI tracking system is key to ensuring that you are maximizing the effectiveness of the program. Here are some strategies to ensure your tracking system is performing at its best:
- Automate Data Entry: Manual data entry can be time-consuming and error-prone. Use automated systems to collect data directly from students’ interactions, assessments, and progress reports. This reduces human error and saves time.
- Utilize Data Visualization: Visual representations of data make it easier to interpret. Use tools like Google Sheets or Excel to create graphs, charts, and dashboards that can instantly show trends in cognitive performance or student satisfaction.
- Set Realistic Benchmarks: When setting targets for your KPIs, ensure that they are realistic and attainable. Overly ambitious goals can set your program up for failure, while underachieving targets might not push students to reach their full potential.
- Monitor Trends Over Time: Rather than focusing only on short-term data, track your KPIs over a longer period (e.g., six months to a year). This provides a more comprehensive view of your program’s success and allows you to spot long-term trends.
FAQs About KPI Spreadsheet Templates for Brain Retraining Academies
What are KPIs, and why are they important for brain retraining academies?
KPIs (Key Performance Indicators) are measurable values that indicate the success of an organization or program in achieving its objectives. In a brain retraining academy, KPIs track important aspects like cognitive improvement, knowledge retention, and student satisfaction, allowing administrators to assess the program’s effectiveness.
How do I track student performance using KPIs?
Student performance can be tracked by measuring metrics such as attendance rates, test scores, and cognitive improvement. These metrics can be automatically updated in a KPI spreadsheet template to give a real-time snapshot of each student’s progress.
Can I customize a KPI spreadsheet for my academy?
Absolutely! A KPI spreadsheet is highly customizable. You can tailor the template to include any metrics that are specific to your academy’s goals, such as specialized cognitive tests or emotional well-being measures.
How often should I update my KPI spreadsheet?
It’s important to update your KPI spreadsheet regularly. For large academies, a monthly update might be necessary to track progress over time. For smaller programs, quarterly updates may be sufficient. The key is to ensure that the data stays current and reflective of the program’s status.
Conclusion
Using a KPI spreadsheet template to track the performance of your brain retraining academy is not just a smart move, it’s essential for ensuring that your program remains effective and efficient. By monitoring key metrics like student progress, cognitive improvement, and overall program satisfaction, you’ll be equipped to make data-driven decisions that improve outcomes for both students and instructors.
The KPI system not only provides transparency and objective insights but also fosters a culture of continuous improvement. As your academy evolves, these metrics will help guide you to new heights of success, ensuring your program stays relevant and impactful. Start implementing your KPI tracking system today and see how it transforms the way you run your brain retraining academy!
For more tips on improving your brain retraining program, visit NeuroTechInsider for expert insights on neurostimulation and cognitive enhancement wearables.